Interactive dashboards
Visual highlighting
When selecting a particular area (points, bars, pie, etc.) on a dashlet, you will notice that related data points on other dashlets immediately light up. This is one of the quickest ways to investigate the relationship between data spread across multiple dashlets.
Right-click menu
Right-click to access additional actions such as:
- Visual filtering
- Drill
Down: This option is available if there are multiple drill paths
configured in the report.
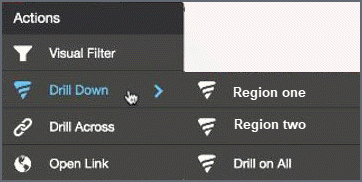
- Drill Across: Drill across linked dashboards.
- Open link: Drill to a configured external link.